OPERATING AND FINANCIAL PERFORMANCE
This material references Disclosures 102-7 of GRI 102: General Disclosures 2016, and 201-1 of GRI 201: Economic Performance 2016
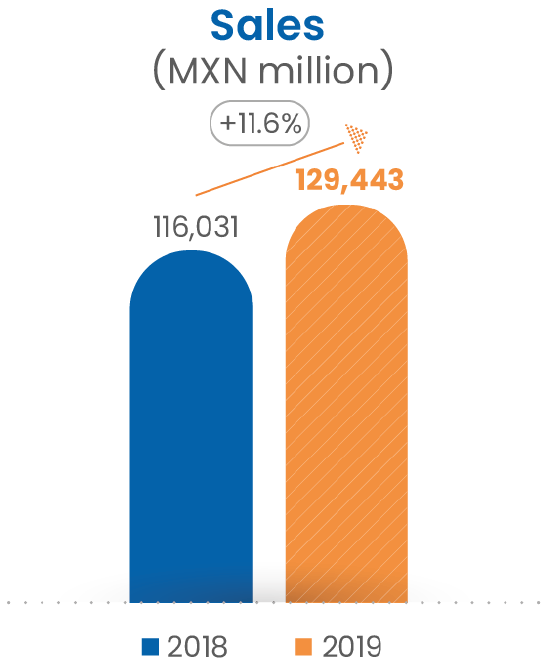
In 2019, consolidated sales grew 11.6% YoY, driven by the net incorporation of 9 stores
in Mexico and the 1.7%
increase in SSS in dollar terms posted by El Super of US Retail segment.
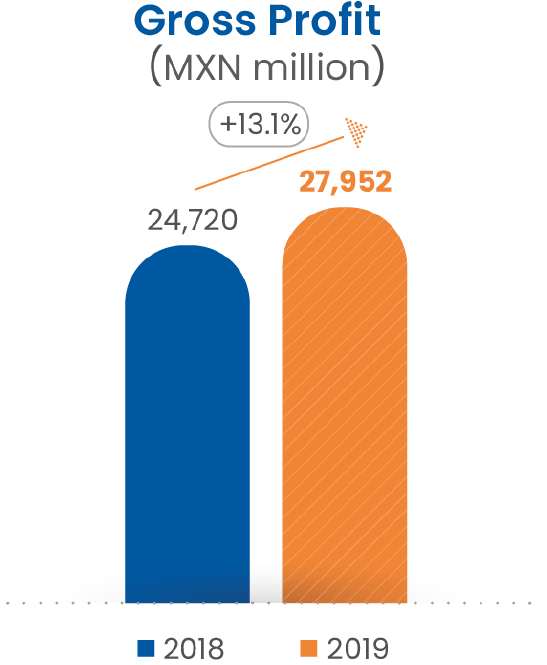
2019 Gross profit went up by 13.1% when compared to that of 2018, fueled by the
combined effect of a
stable gross margin in Mexico Retail segment and an enhanced margin in US.
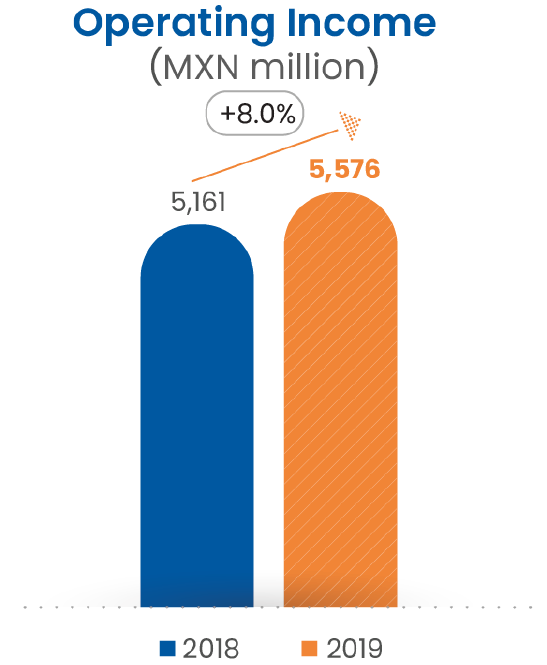
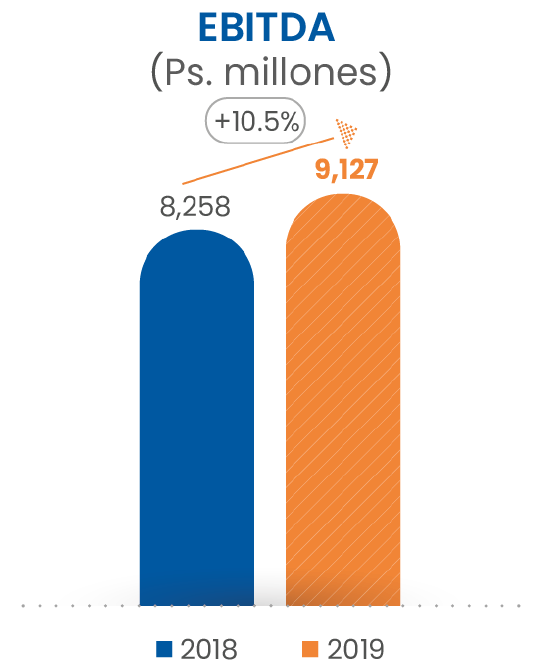
Operating Income and EBITDA recorded annual hikes of 8.0% and 10.5%, respectively, in line with the climb in gross profit, which offset the growth in operating expenses.
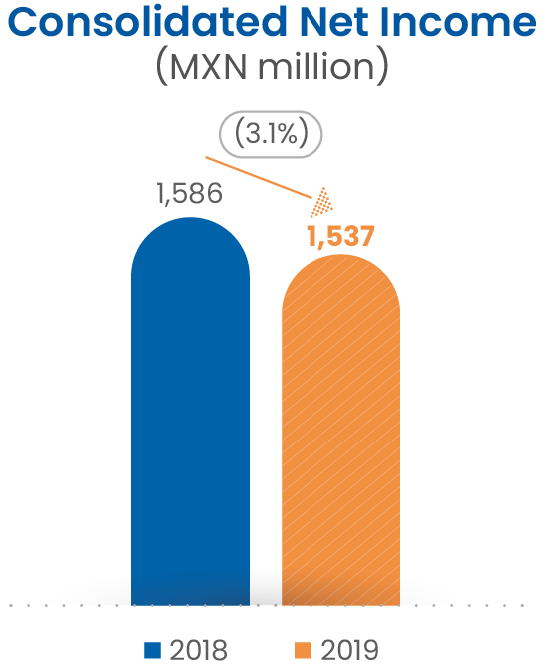
2019 Consolidated net income decreased 3.1% versus 2018, explained by higher
financing costs
coupled with a higher amount of income taxes.
Consolidated Income Statement
| Figures in millions of pesos | 2018 | 2019 | Var. |
|---|---|---|---|
| Net Sales | 116,031 | 129,443 | 11.6% |
| Gross Profit | 24,720 | 27,952 | 13.1% |
| Operating Expenses (excluding Depreciation) | 16,462 | 18,825 | 14.4% |
| EBITDA | 8,258 | 9,127 | 10.5% |
| Consolidated Net Income | 1,586 | 1,537 | (3.1%) |
| Net Majority Income | 1,638 | 1,566 | (4.4%) |
| Basic Earnings Per Share | 1.70 | 1.64 | (3.5%) |
| Outstanding Shares | 963,917,211 | 963,917,211 | N/A |
| Share Price (Dec. 31) | 39.40 | 27.12 | (31.2%) |
Consolidated Balance Sheet
| Figures in millions of pesos | 2018 | 2019 | Var. |
|---|---|---|---|
| Cash | 1,252 | 984 | (21.4%) |
| Inventory | 12,871 | 13,471 | 4.7% |
| Fixed Assets (Net) | 69,119 | 68,793 | (0.5%) |
| Total Assets | 87,463 | 87,392 | (0.1%) |
| Suppliers | 18,798 | 18,446 | (1.9%) |
| Total Liabilities | 60,636 | 59,982 | (1.1%) |
| Majority Shareholder Investment | 26,827 | 27,410 | 2.2% |
Retail Operation Highlights
| Stores in Mexico | 2018 | 2019 | Net Change |
|---|---|---|---|
| Tiendas Chedraui | 193 | 198 | 5 |
| Súper Chedraui | 62 | 60 | (2) |
| Súper Che | 11 | 15 | 4 |
| Supercito | 31 | 33 | 2 |
| Total in Mexico | 297 | 306 | 9 |
| Stores in US | 2018 | 2019 | Net Change |
| El Super | 64 | 64 | - |
| Fiesta | 61 | 61 | - |
| Total in US | 125 | 125 | - |
| TOTAL Stores | 422 | 431 | 9 |
RETAIL IN MEXICO
As of December 31st, 2019, our Retail segment in Mexico counted with 9 more stores than that of same date in 2018, given the net incorporation of 5 Tiendas Chedraui (including 1 Tienda Chedraui Selecto), 4 Súper Che and 2 Supercito. On the other hand, Súper Chedraui stores decreased by 2 units with respect to 2018, due to changes in the store format. The foregoing resulted in an annual 2.2% expansion in our total sales floor.
Sales in Mexico grew 7.7% with respect to 2018.
EBITDA increased 2.6% YoY, due to the increase in operating expenses, which came higher than the growth in sales.
| Figures in millions of pesos | 2018 | 2019 | Var. |
|---|---|---|---|
| Sales | 71,587 | 77,090 | 7.7% |
| EBITDA | 5,448 | 5,589 | 2.6% |
| EBITDA Margin | 7.6% | 7.2% | (0.4 p.p.) |
RETAIL IN THE U.S.
During 2019, we focused our efforts towards the operating consolidation of Fiesta, therefore, no store openings were conducted in this segment.
Revenue from US Retail increased 17.9% when compared to that of last year.
EBITDA from this segment surged 39.6%, benefited by the combination of a slower growth in operating expenses compared to the increase of sales, in El Super; and the effects of a more stable operation in Fiesta, due to the achievement of operating and administrative synergies inherent to the consolidation of this business.
| Figures in millions of pesos | 2018 | 2019 | Var. |
|---|---|---|---|
| Sales | 43,525 | 51,304 | 17.9% |
| EBITDA | 2,014 | 2,811 | 39.6% |
| EBITDA Margin | 4.6% | 5.5% | 0.9 p.p. |
EBITDA Breakdown
| Figures in millions of pesos | 2018 | 2019 | Var. |
|---|---|---|---|
| El Super | 1,602 | 2,075 | 29.6% |
| Fiesta | 412 | 736 | 78.5% |
| Total | 2,014 | 2,811 | 39.6% |
REAL ESTATE DIVISION
Revenues from our Real Estate division climbed 14.1% with respect to 2018, following the increases in lease contracts tied to inflation, as well as the incorporation of 18,216 sqm (+5.1% YoY) of leasable area.
EBITDA from this segment fell 8.7% YoY, given a higher comparison base, as in 2018 a favorable investment properties valuation was registered, bolstering EBITDA, while in fiscal year 2019 said valuation did not cause any adjustment.
| Figures in millions of pesos | 2018 | 2019 | Var. |
|---|---|---|---|
| Sales | 919 | 1,048 | 14.1% |
| EBITDA | 796 | 727 | (8.7%) |
| EBITDA Margin | 86.7% | 69.3% | (1,736 p.p.) |
Financing
By the end of December 2019, our net bank debt amounted to Ps.9,517 million, comprised of Ps.1,768 million of short-term debt, Ps.8,733 million of long-term debt and Ps.984 million in cash and equivalents.
Accumulated invested CAPEX from January to December in 2019 was Ps.4,092 million.
With these results, the net bank debt to EBITDA ratio as of December 31st, 2019 stood at 1.04 times, slightly less than the 1.07 times at the end of December 2018.